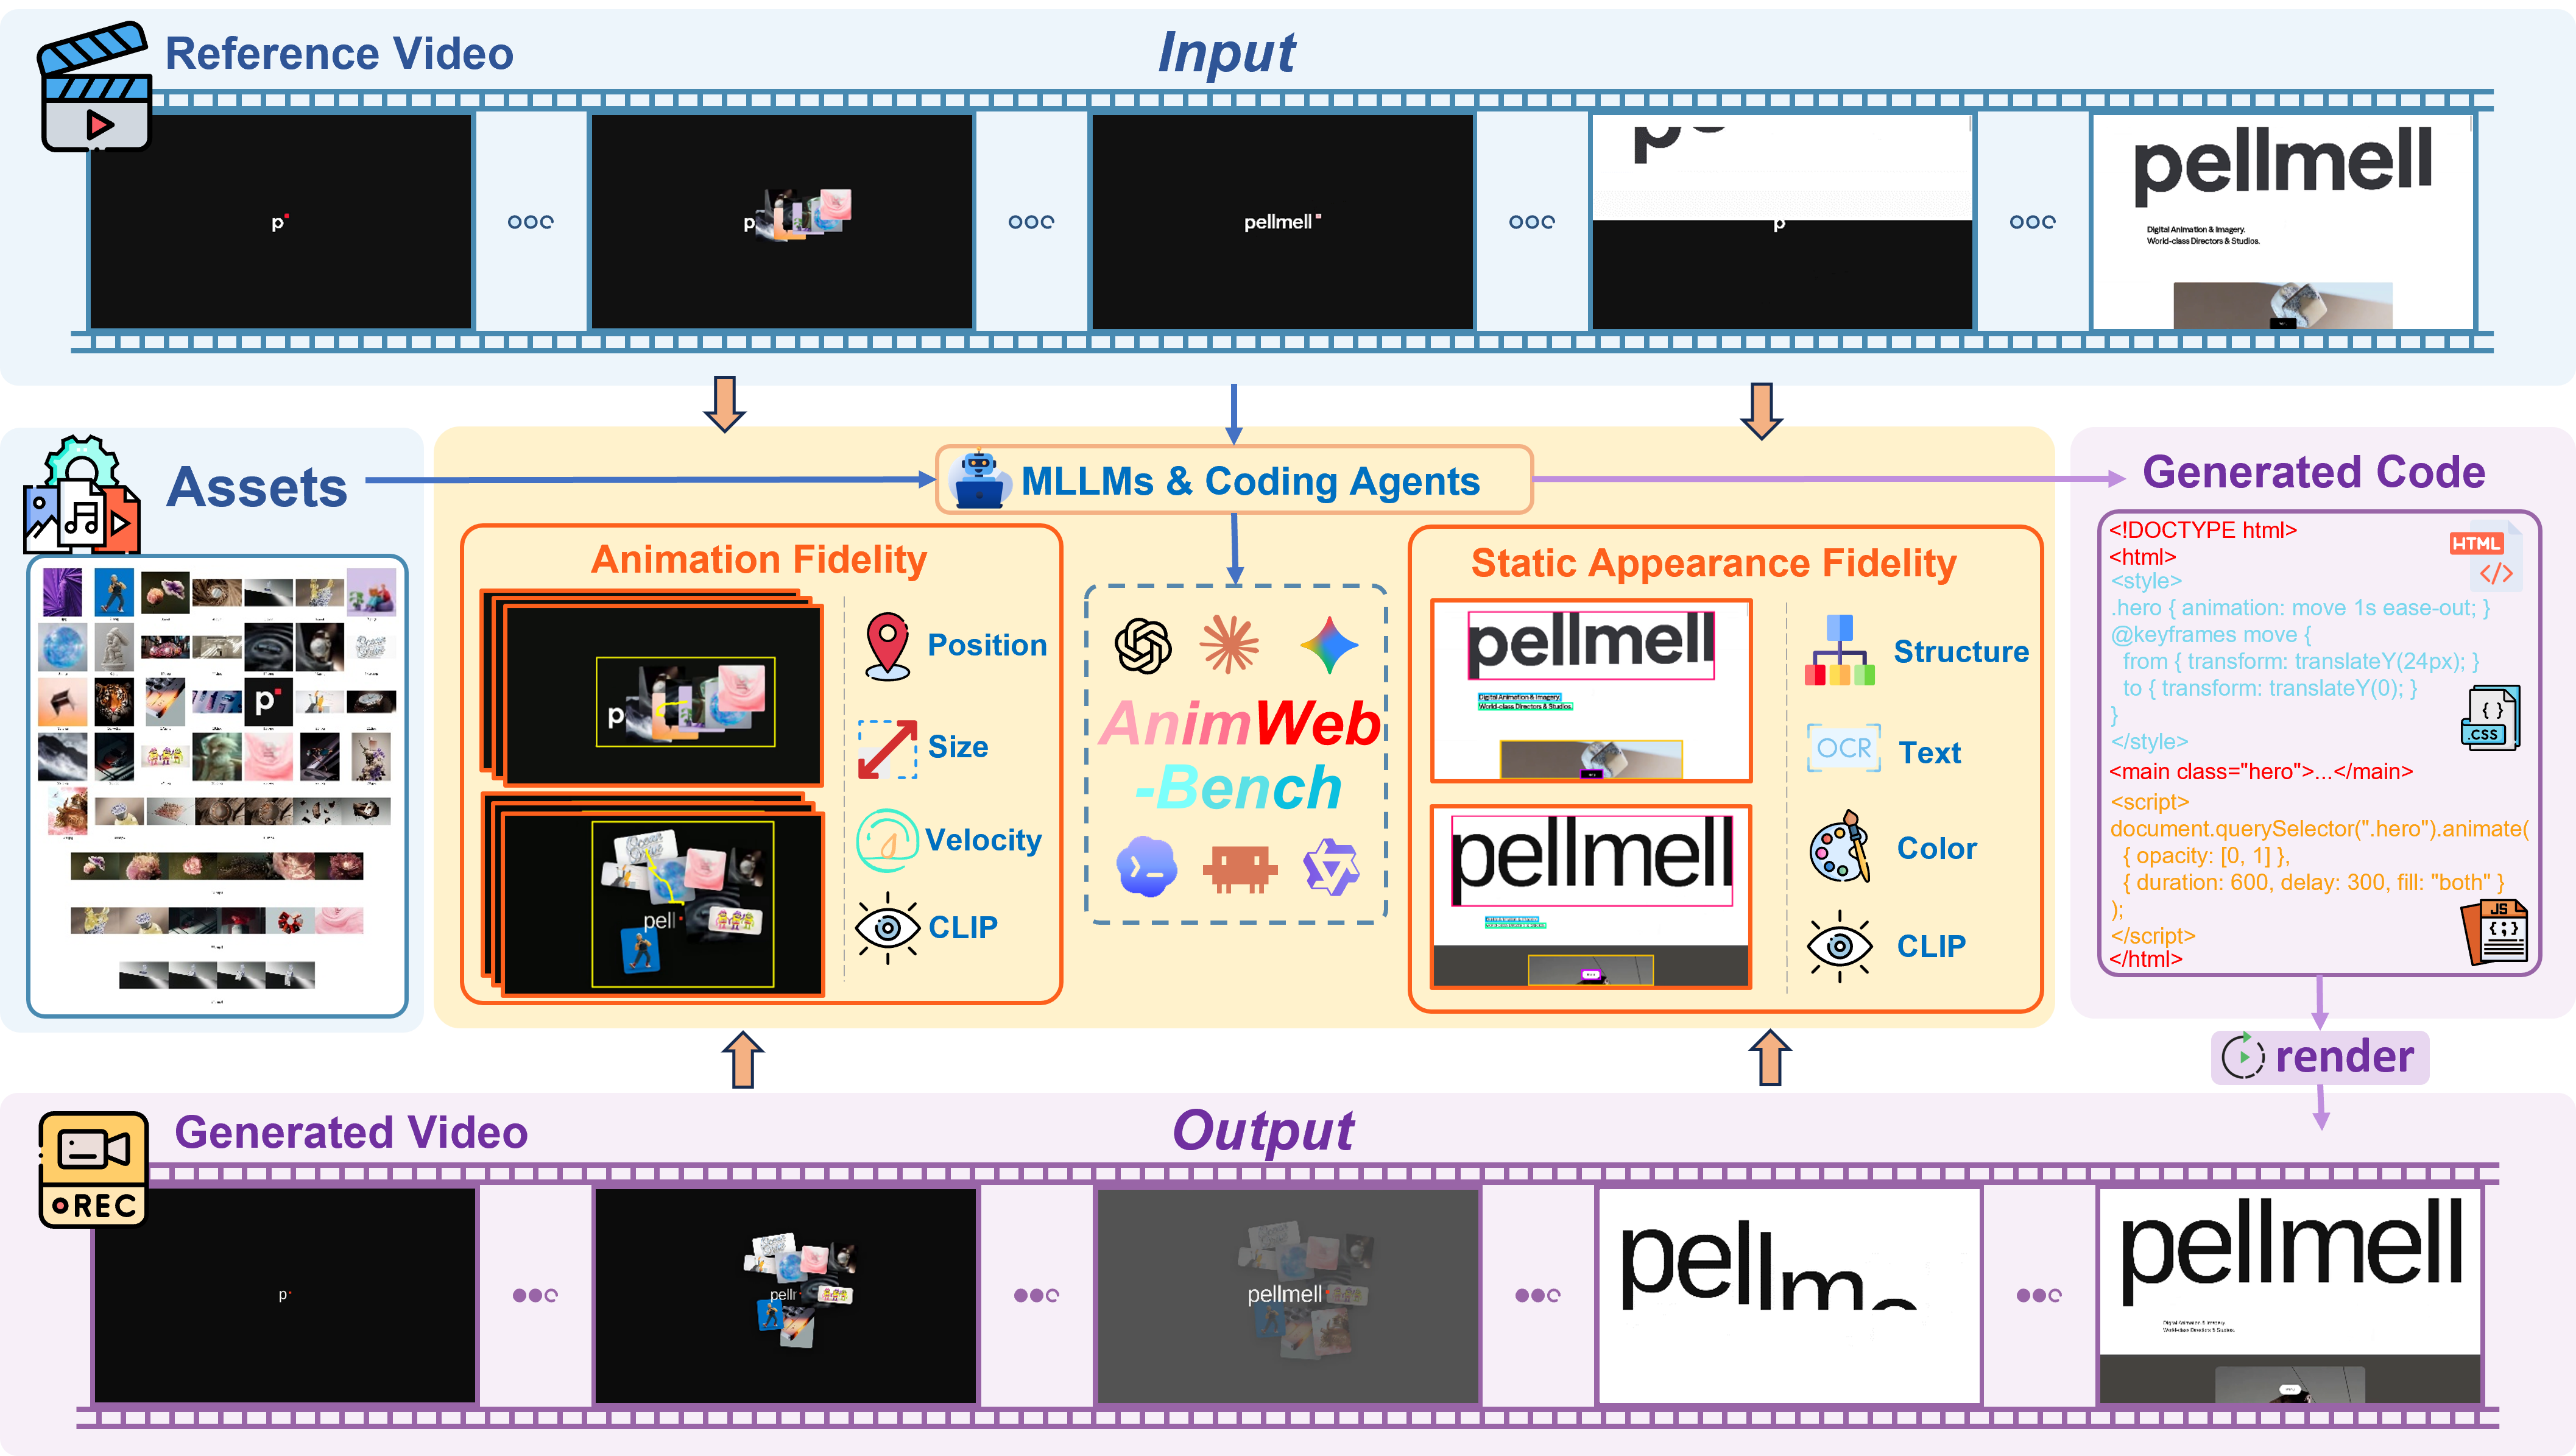
Can AI systems reconstruct not only the visual states of a webpage, but also the continuous dynamics connecting them?
To address this challenge, we introduce AnimWeb-Bench, the first benchmark for animated webpage code generation from videos.
Can AI systems reconstruct not only the visual states of a webpage, but also the continuous dynamics connecting them?
To address this challenge, we introduce AnimWeb-Bench, the first benchmark for animated webpage code generation from videos.
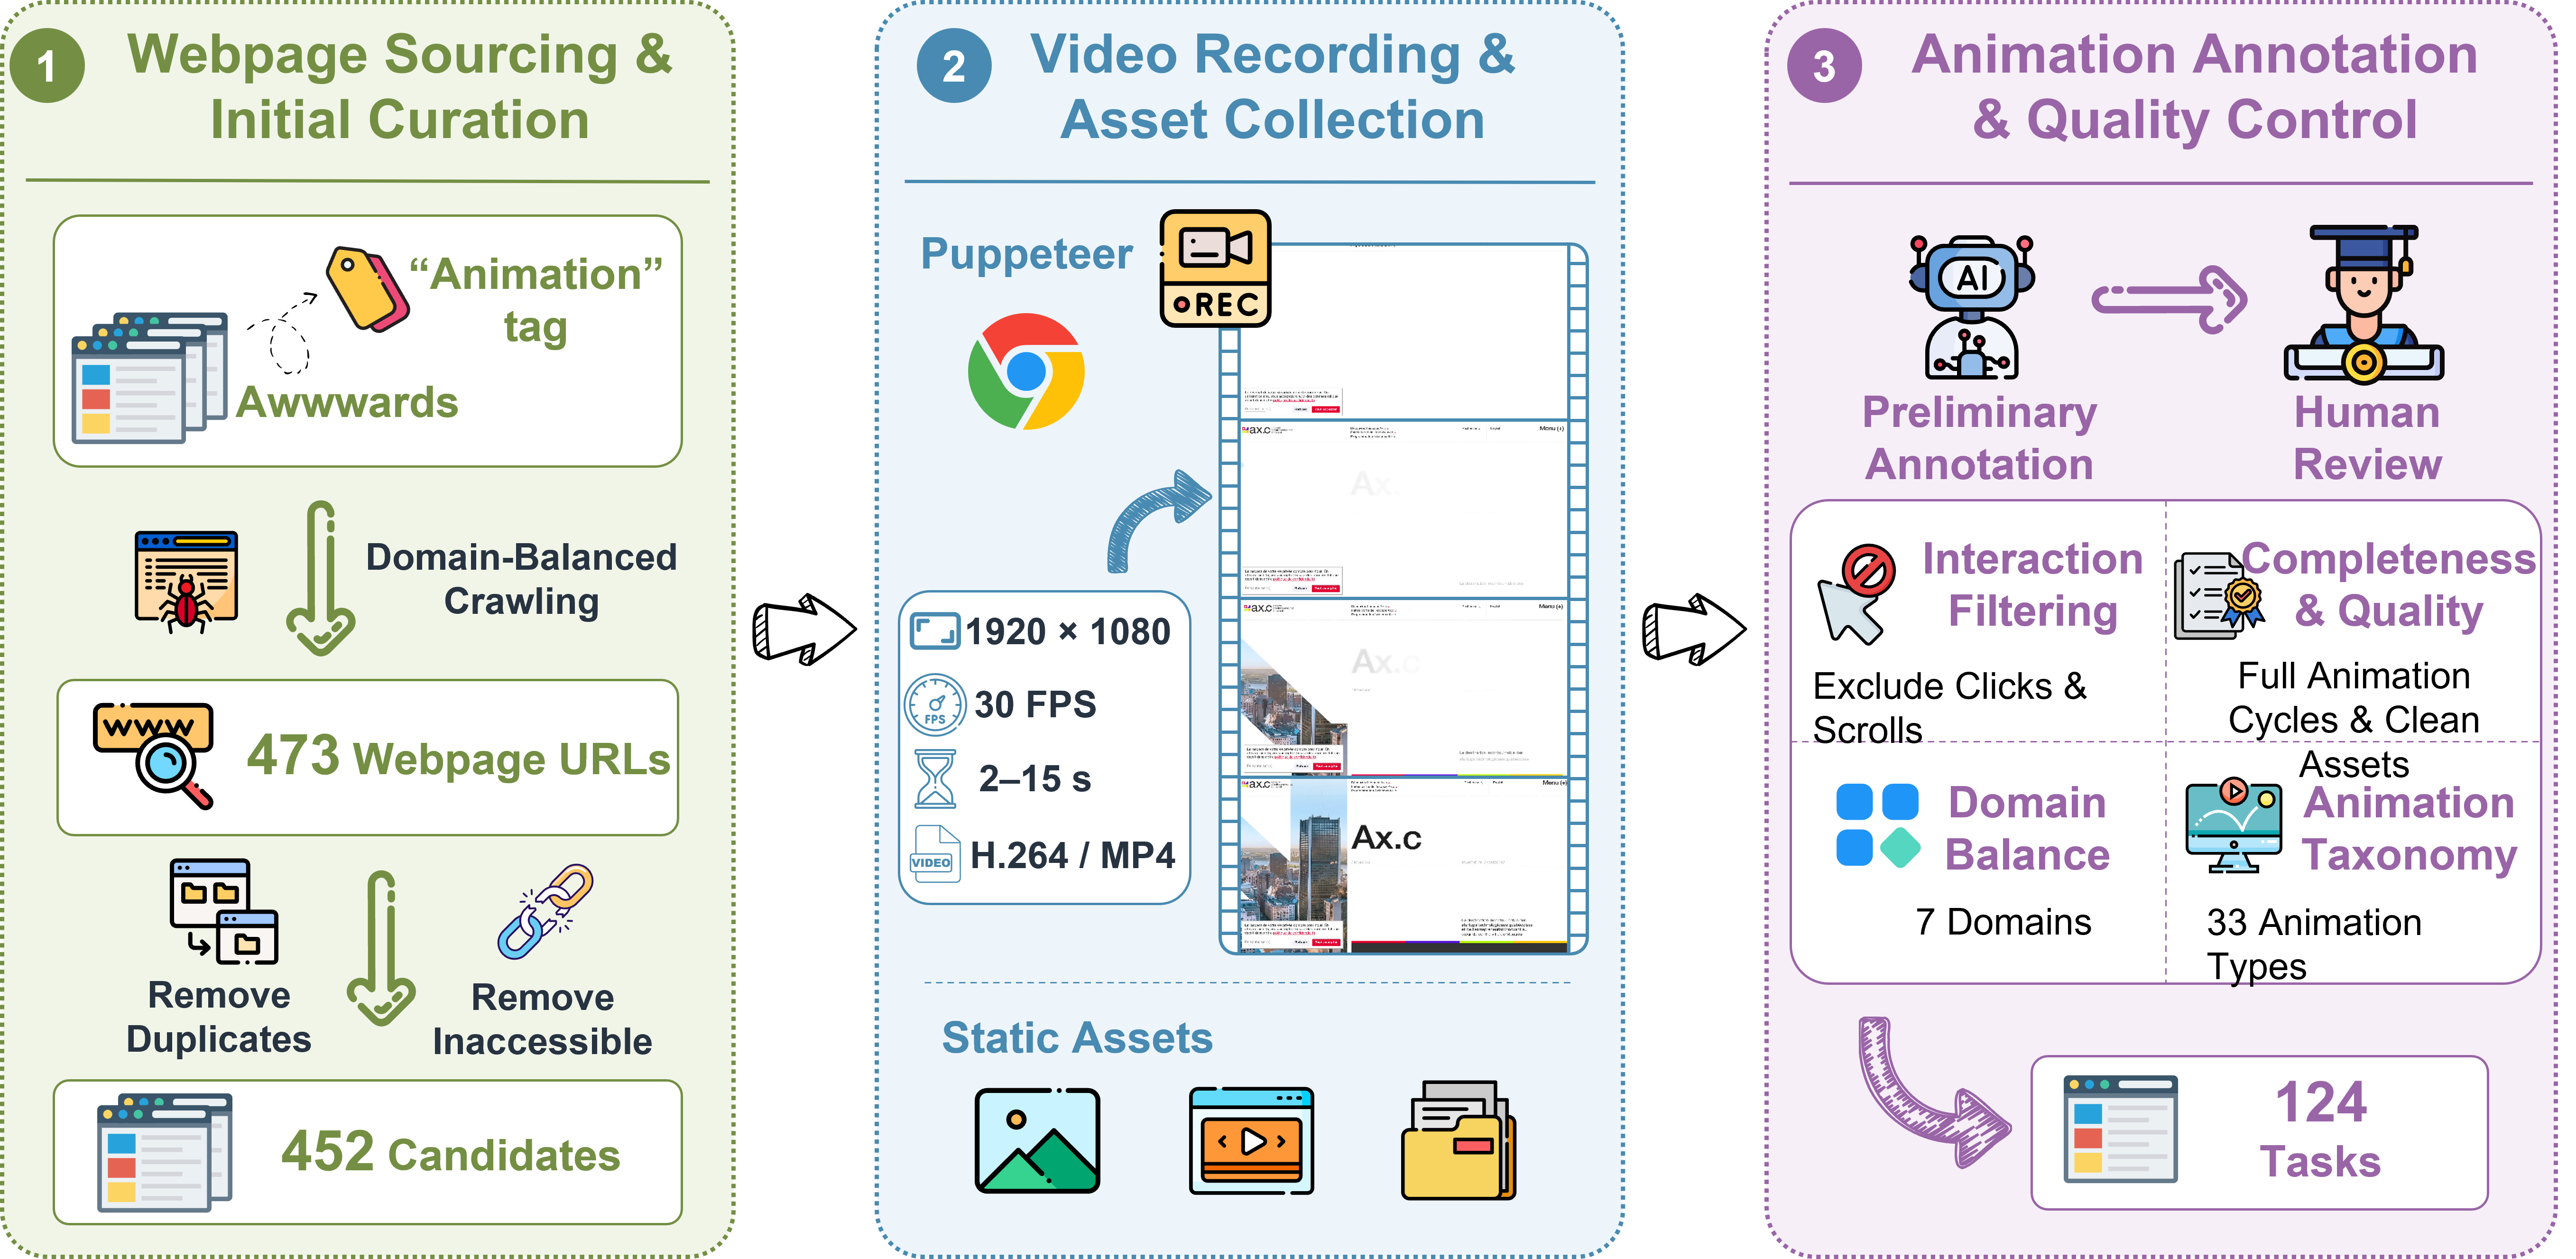
Scope. AnimWeb-Bench focuses on time-driven, page-embedded animations that unfold automatically during the initial page load. We consider animations implemented through DOM elements using CSS or JavaScript, where motion is integrated with the webpage's layout, text, and media.
Webpage sourcing. We draw webpages from Awwwards, a web-design showcase whose entries are reviewed by a jury of professional designers and developers. Starting from sites carrying the Animation tag, we crawled up to 100 sites per application domain, collecting 473 URLs of sites submitted between 2025 and 2026. Removing duplicate and inaccessible sites left 452 candidates.
Recording and asset collection. We load each page in headless Chromium (v151.0.7922.34) driven by Puppeteer with a 1920 × 1080 viewport and record it at 30 fps (H.264, MP4) from navigation start. Each recording lasts 2–15 s (mean 5.91 s) and covers the page's initial animation sequence, or one full cycle of a looping animation. We also crawl and deduplicate the static assets needed for reconstruction, i.e., images, icons, and embedded videos (46.1 per page on average).
Annotation and quality control. We first use GPT-5.6 Sol to propose a domain and a set of animation-type labels for each recording from the video and the page source. Three PhD students with front-end development experience then review every instance: they correct the labels, supplement missing assets, and verify that the recording captures the complete animation.
AnimWeb-Bench comprises 124 real-world webpages spanning 7 application domains and 33 animation types. With 91.9% of webpages combining multiple animation types, the benchmark captures the diversity and complexity of animations found on real-world websites.
| Metric | Min | Max | Mean ± Std |
|---|---|---|---|
| Duration (s) | 2.0 | 15.0 | 5.91 ± 2.47 |
| Segments | 1 | 11 | 2.83 ± 1.84 |
| Tracklets | 2 | 120 | 35.4 ± 24.1 |
| Asset Files | 2 | 422 | 46.1 ± 53.6 |
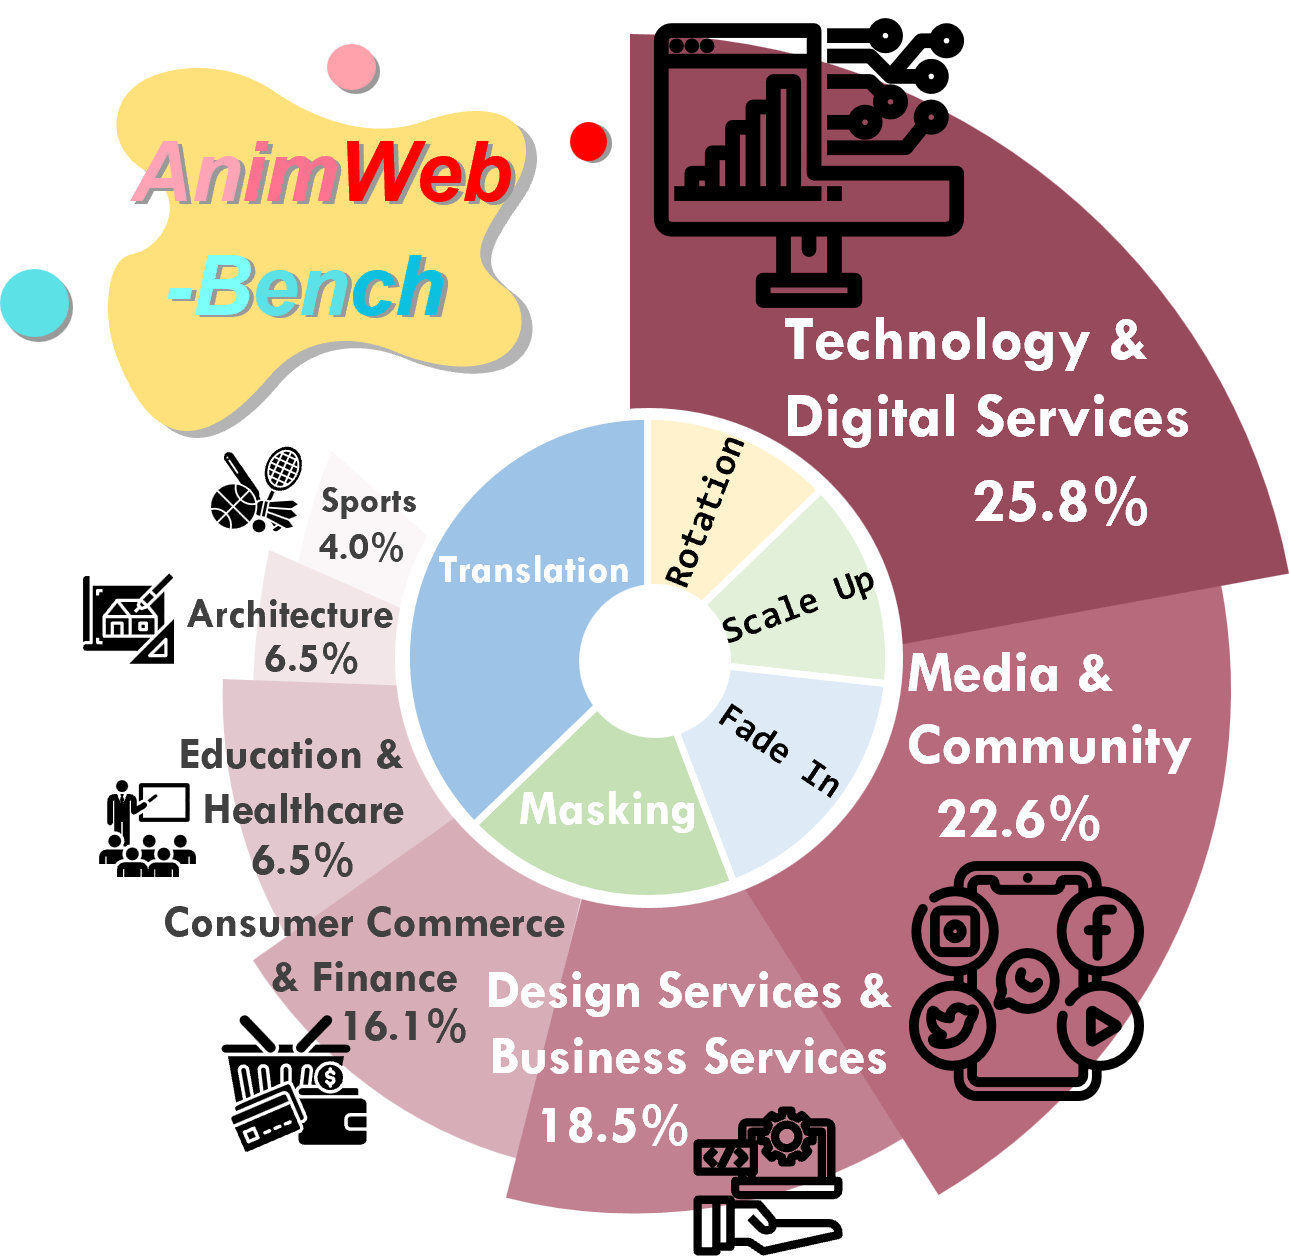
Domain distribution of AnimWeb-Bench.
We compare the code complexity of AnimWeb-Bench with existing webpage code generation benchmarks using HTML length, tag count, DOM depth, and the number of unique tags.
| Metric | Design2Code | WebCode2M | MRWeb | Animation2Code | AnimWeb-Bench |
|---|---|---|---|---|---|
| Length (tokens) |
31,216 ± 23,902 |
5,366 ± 2,393 |
113,724 ± 139,761 |
5,427 ± 13,678 |
239,303 ± 487,624 |
| Tags |
158 ± 100 |
184 ± 77 |
543 ± 768 |
71 ± 247 |
1,196 ± 894 |
| DOM Depth |
13 ± 5 |
15 ± 5 |
15 ± 6 |
5 ± 3 |
18 ± 4 |
| Unique Tags |
22 ± 6 |
24 ± 6 |
22 ± 8 |
7 ± 2 |
33 ± 7 |
AnimWeb-Bench contains 404 animation-type annotations, averaging 3.3 types per webpage.
| Animation Type | Count | Animation Type | Count |
|---|---|---|---|
| Translation | 64 | Fade Out | 12 |
| Background Transition | 50 | Rotation | 11 |
| Appearance | 49 | Numeric Counter Animation | 10 |
| Masking | 32 | Scale Down | 8 |
| Fade In | 30 | Text Substitution | 7 |
| Text Animation | 24 | Image Stack Animation | 5 |
| Scale Up | 22 | Typewriter Animation | 5 |
| Color Transition | 14 | Vertical Stripe Reveal | 5 |
| Line Growth | 13 | Appearance & Opacity Changes | 5 |
| Blur Transition | 4 | 3D Depth Motion | 3 |
| Icon State Animation | 4 | Grid Tile Transition | 3 |
| Shake | 4 | Icon State Transition | 3 |
| Font Weight Animation | 2 | Text Scramble | 3 |
| Horizontal Image Slide | 2 | Twinkling | 3 |
| Vertical Image Slide | 2 | Card Flip | 2 |
| Logo Morphing | 1 | Text Fragmentation | 1 |
| Radial Expansion Animation | 1 |
An illustration of UI component detection and tracking across frames of an animated webpage.
We evaluate 14 MLLMs and 3 coding agents on AnimWeb-Bench. Our experiments investigate overall reconstruction performance, the effectiveness of coding agents, the impact of animation types, and alignment with human judgments.
How well do state-of-the-art MLLMs reconstruct animated webpages?
| Model | Static Appearance Fidelity | Animation Fidelity | ||||||
|---|---|---|---|---|---|---|---|---|
| Structure | Text | Color | CLIP | Position | Size | Velocity | CLIP | |
| Proprietary MLLMs | ||||||||
| GPT-6 Astra | 0.6974 | 0.7804 | 0.7452 | 0.8796 | 0.4532 | 0.4193 | 0.3043 | 0.4303 |
| GPT-6 Sol | 0.5754 | 0.6726 | 0.6557 | 0.8084 | 0.3735 | 0.3359 | 0.2401 | 0.3511 |
| GPT-5.6 Sol | 0.5598 | 0.6503 | 0.6604 | 0.7898 | 0.3577 | 0.3164 | 0.2312 | 0.3355 |
| Claude Fable 5.1 | 0.5952 | 0.7101 | 0.7014 | 0.8516 | 0.3928 | 0.3495 | 0.2653 | 0.3660 |
| Claude Opus 5 | 0.5183 | 0.6240 | 0.6464 | 0.7907 | 0.3123 | 0.2710 | 0.2048 | 0.2922 |
| Grok 4.7 | 0.4575 | 0.6384 | 0.6169 | 0.7776 | 0.3170 | 0.2561 | 0.2133 | 0.2960 |
| Qwen3.8 Max (0902)† | 0.4273 | 0.5797 | 0.5589 | 0.7643 | 0.3016 | 0.2446 | 0.2026 | 0.2793 |
| Gemini 3.1 Pro Preview† | 0.3453 | 0.5212 | 0.5449 | 0.7046 | 0.2313 | 0.1790 | 0.1456 | 0.2148 |
| Gemini 3.8 Flash† | 0.3324 | 0.5061 | 0.5220 | 0.6794 | 0.2301 | 0.1761 | 0.1530 | 0.2117 |
| Doubao-Seed-2.1-pro† | 0.3378 | 0.4695 | 0.5149 | 0.6127 | 0.2060 | 0.1586 | 0.1238 | 0.1908 |
| Open-Weight MLLMs | ||||||||
| Kimi K3† | 0.5373 | 0.6775 | 0.6564 | 0.8204 | 0.3463 | 0.2978 | 0.2246 | 0.3218 |
| DeepSeek V4.1 Flash | 0.4393 | 0.5820 | 0.5854 | 0.7530 | 0.3063 | 0.2543 | 0.1983 | 0.2836 |
| GLM 5.3 Flash† | 0.4293 | 0.5707 | 0.5750 | 0.7441 | 0.2953 | 0.2390 | 0.1960 | 0.2733 |
| Qwen3 VL 235B A22B Thinking† | 0.2395 | 0.4032 | 0.4337 | 0.5770 | 0.1702 | 0.1294 | 0.1170 | 0.1584 |
Performance comparison. All metrics are higher-is-better. Models marked with † receive the native video, and the others receive frames sampled at 2 fps. The best and second-best scores are marked in bold and underlined, respectively.
Animation fidelity is low across the board. Even GPT-6 Astra, the strongest model, scores below 0.46 on every animation metric, and ten of the remaining thirteen models stay below 0.35. For every model, each animation score falls below each static score, and Velocity is the lowest of all eight metrics. Because the two dimensions are computed differently, their absolute values are not directly comparable. Two further observations, however, show that the gap reflects motion rather than scale. Animation metrics respond to the kind of motion on a page while static metrics do not, and human annotators prefer every evaluated model over the baseline less often on animation than on static appearance.
Current models fail to infer and encode component-level dynamics in three ways. First, some animated components are missing from the generated page altogether, and their unmatched trajectories lower all four animation scores. Second, even when a component is animated, its trajectory or manner of change may deviate from the reference. For example, sliding along a different path or scaling instead of sliding, which lowers Position and Size. Third, and most subtle, is the temporal behavior of motion, namely when and how fast each component moves. Components may move faster, slower, or in a different direction than in the reference, which lowers Velocity. They may also appear at the wrong time: elements that the reference reveals gradually or one after another may appear all at once in the generated page, leaving time steps at which only one of the matched components is present and thus lowering all four animation scores. Faithfully recovering how a webpage moves thus remains an open challenge for current models.
GPT-6 Astra leads all eight metrics, and Claude Fable 5.1 ranks second on every metric. Among open-weight models, Kimi K3 ranks third in static Text and CLIP, surpassing GPT-6 Sol, and fifth across all animation metrics, outperforming Claude Opus 5 and approaching GPT-5.6 Sol. DeepSeek V4.1 Flash and GLM 5.3 Flash perform on par with the proprietary Grok 4.7 and Qwen3.8 Max (0902), and all four outperform the two Gemini models and Doubao-Seed-2.1-pro across all metrics.
How effectively do coding agents reconstruct animated webpages, and what affects their performance?
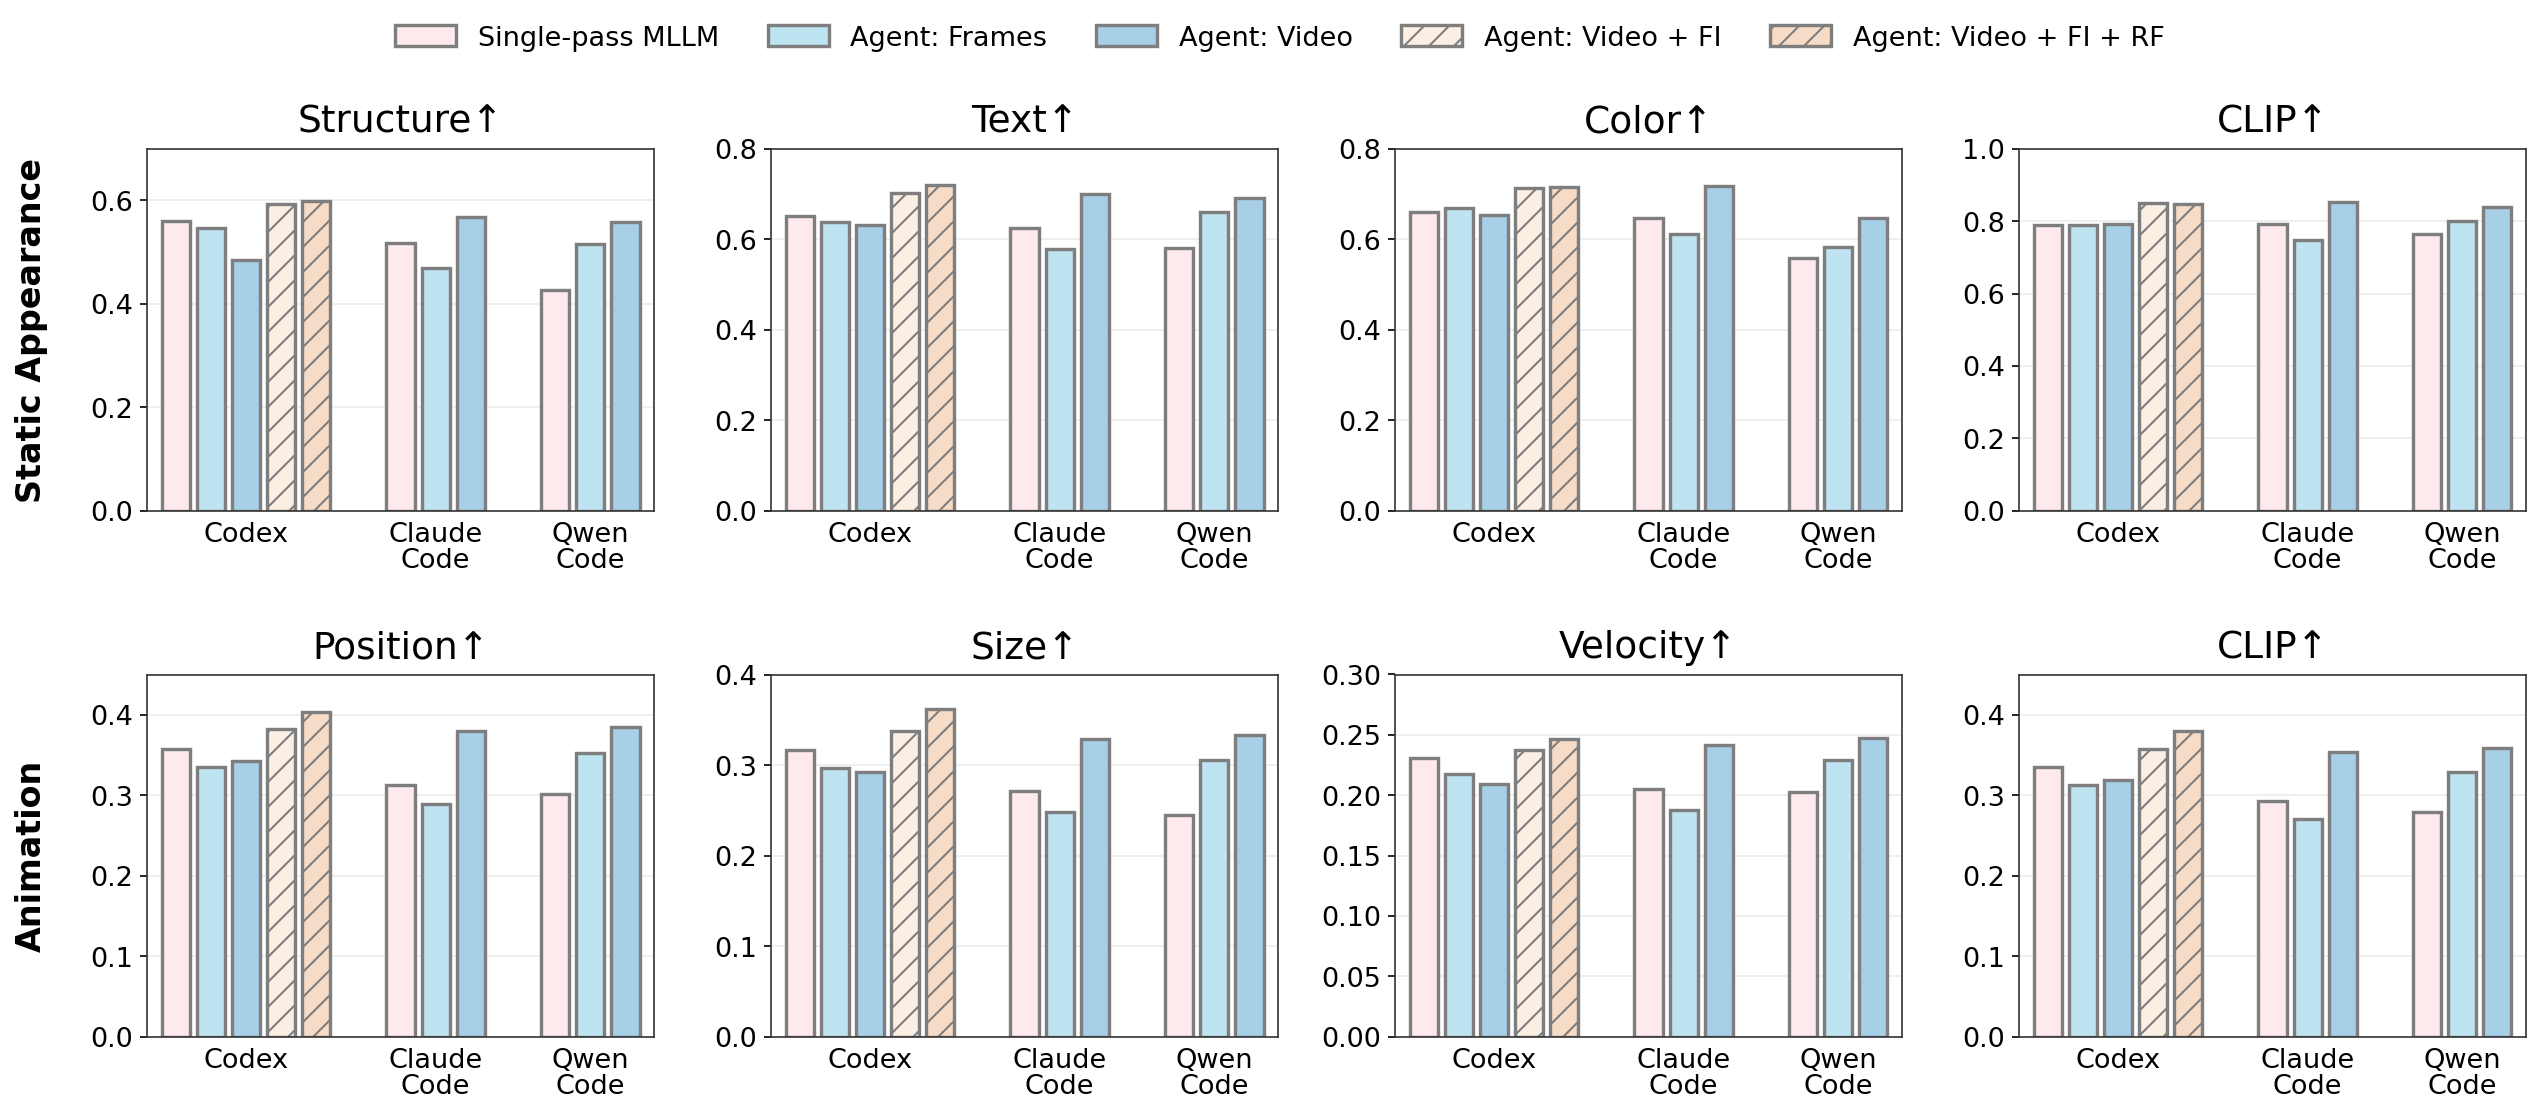
Comparison of coding agents with their underlying MLLMs in single-pass generation. Codex is additionally evaluated with frame inspection (FI) and render feedback (RF).
We compare each agent with its own underlying MLLM, and find that the benefit of agentic generation depends on both the agent and the input format. Qwen Code outperforms Qwen3.8 Max (0902) on all eight metrics under both settings, with relative gains of 4.3%–24.7% under Frames and 9.7%–36.1% under Video. Claude Code shows a reversal: it falls below Claude Opus 5 on all eight metrics under Frames, yet surpasses it on all eight under Video, with relative gains of 7.9%–21.7%. Codex, by contrast, trails GPT-5.6 Sol on six metrics under Frames and seven under Video, with the remaining metrics changing by at most 1.4%.
Comparing the two input formats, Video yields higher scores than Frames on all eight metrics for both Claude Code and Qwen Code, suggesting that video is generally the more informative input. Unlike the fixed 2 fps frames, a video allows an agent to choose its own sampling rate, for example, sampling densely around transitions, and can thus reveal intermediate states and timing that sparse frames miss. For Codex, however, Video outperforms Frames on only three metrics, indicating that this flexibility does not automatically translate into better reconstruction. The way in which an agent perceives visual input is therefore critical to its performance.
To understand why Codex lags behind, we examine its execution traces under Video. We observe that Codex often extracts frames from the video, tiles them into contact sheets (e.g., nine frames per image), and relies on these sheets rather than on the individual frames. Such reduced tiles may obscure fine visual details and subtle changes between frames. We therefore introduce two additional Video settings for Codex. In Video + Frame Inspection (Video+FI), the prompt instructs Codex to also inspect each source frame individually at its original resolution whenever it builds a contact sheet. Video + Frame Inspection + Render Feedback (Video+FI+RF) further provides a recording tool that renders the generated page into a video, allowing Codex to compare its output with the reference and revise the code iteratively.
The two enhancements improve Codex in different ways. Compared with Video, Video+FI improves all eight metrics by 7.3%–22.0% on the static metrics and 11.6%–15.6% on the animation metrics, and outperforms GPT-5.6 Sol on every metric. Building on Video+FI, Video+FI+RF further raises all four animation metrics by 4.0%–7.0%, whereas the static metrics change by only −0.3% to 2.5%. Frame inspection thus improves overall fidelity, while render feedback mainly benefits animation, likely because comparing the rendered page with the reference video exposes motion errors that are hard to detect from the code alone.
With both enhancements, Codex outperforms GPT-6 Sol on all eight metrics and Claude Fable 5.1 on six, second only to GPT-6 Astra on most metrics. These results suggest that the bottleneck of agentic reconstruction lies not only in code generation but also in perception and verification: an agent improves substantially once it observes the reference closely and checks how its own page actually moves. Because the frame-inspection instruction was derived from Codex's traces on this benchmark, we treat Video+FI and Video+FI+RF as diagnostic interventions that locate the bottleneck rather than as tuned methods.
How does the performance of current systems vary across different animation types?
To compare performance across animation types, we divide the 124 webpages into three mutually exclusive groups based on animation type labels. Spatial Motion contains at least one animation that moves components in space, such as translation, rotation, shake, or card flip. Property Change contains no spatial motion but includes changes beyond visibility, such as scaling, color transitions, text animations, or numeric counters. Visibility Only contains only animations in which components appear or fade in.
| Group | Static Appearance Fidelity | Animation Fidelity | ||||||
|---|---|---|---|---|---|---|---|---|
| Structure | Text | Color | CLIP | Position | Size | Velocity | CLIP | |
| By Animation Category | ||||||||
| Spatial Motion | 0.4615 | 0.6110 | 0.6049 | 0.7523 | 0.2911 | 0.2445 | 0.1855 | 0.2703 |
| Property Change | 0.4654 | 0.5702 | 0.5919 | 0.7505 | 0.3190 | 0.2701 | 0.2141 | 0.2988 |
| Visibility Only | 0.4811 | 0.6715 | 0.6284 | 0.8056 | 0.4325 | 0.3797 | 0.3291 | 0.4095 |
| By Temporal Behavior | ||||||||
| Rapid, Continuous Change | 0.3761 | 0.4972 | 0.5299 | 0.6883 | 0.2379 | 0.1969 | 0.1307 | 0.2228 |
| Discrete State Transition | 0.4886 | 0.6305 | 0.6414 | 0.7761 | 0.4194 | 0.3591 | 0.3004 | 0.3940 |
Average scores of the 14 MLLMs on webpages grouped by animation category and temporal behavior.
Animation fidelity declines as the animations involve more motion. On animation metrics, Visibility Only scores the highest, followed by Property Change, while Spatial Motion scores the lowest, with a Velocity only 56% that of Visibility Only. This ordering reflects the demands of each group. Visibility changes only require models to determine when elements appear, and property changes alter the size, color, or content of components with limited motion, whereas spatial motion requires recovering how each element travels over time.
The static metrics behave differently: between Spatial Motion and Property Change, they differ by −0.8% to +7.2% with no consistent direction, whereas all four animation metrics drop by 8.7%–13.4%. Animation categories thus mainly affect how well models reproduce motion rather than appearance, which shows that Animation Fidelity captures differences that the static metrics miss.
Among individual animation types, the most challenging ones change the page rapidly and continuously, often across many elements at once, such as Card Flip, Twinkling, Text Scramble, Text Fragmentation, Shake, and Numeric Counter Animation. Their intermediate states shift at nearly every frame, making the timing difficult to infer from the reference video and to express precisely in code.
The easiest types, such as Font Weight Animation, Icon State Transition, and Text Substitution, are instead discrete transitions between two clearly visible states, requiring models only to identify the start and end states and connect them with a simple transition. This contrast is also reflected in the experimental results, where webpages with rapid, continuous changes score lower on all metrics than those with discrete state transitions.
How do humans assess the reconstructed animated webpages?
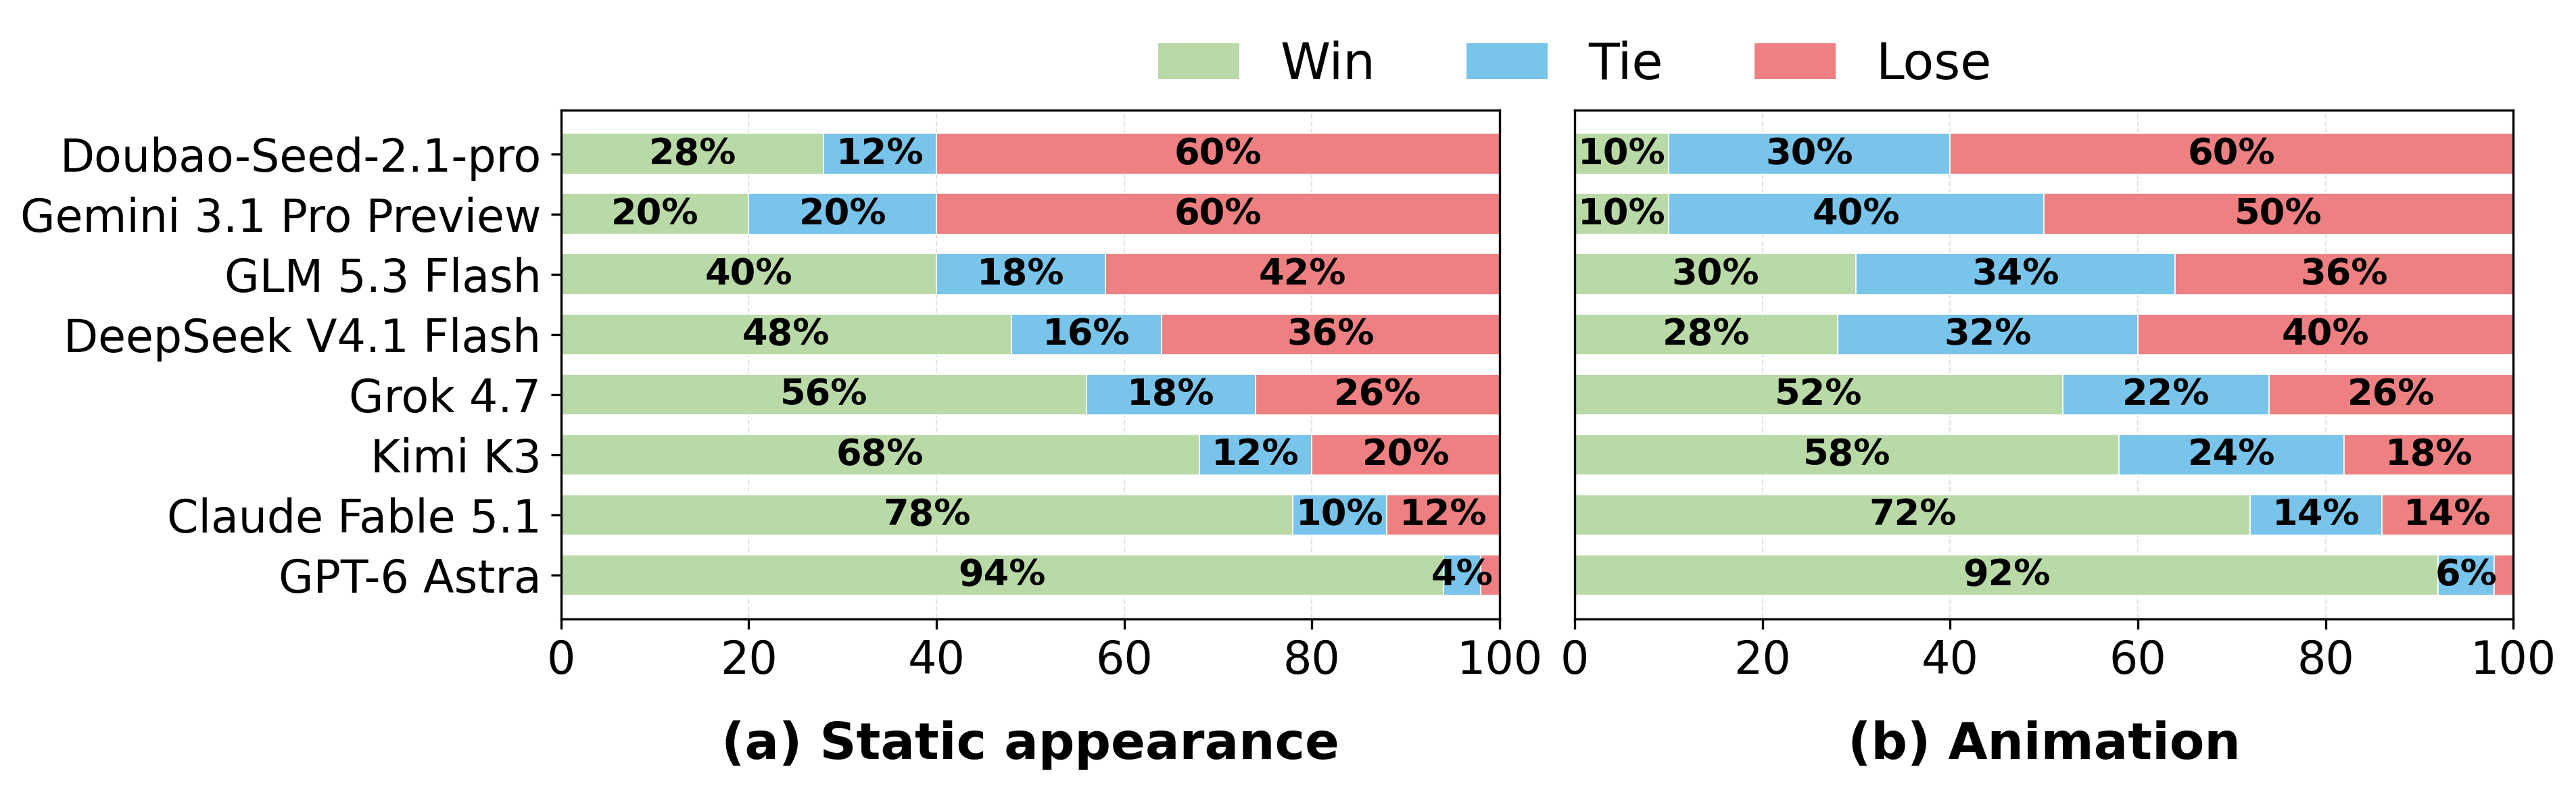
Human evaluation results against Qwen3.8 Max (0902) on 50 sampled webpages.
In both dimensions, human evaluators rank the models in nearly the same order as our automatic metrics. GPT-6 Astra is preferred over the baseline on 94% of the webpages for static appearance and 92% for animation, followed by Claude Fable 5.1, Kimi K3, and Grok 4.7, whose win rates decline in the same order as their automatic scores.
DeepSeek V4.1 Flash and GLM 5.3 Flash perform close to the baseline, with comparable win and loss rates, consistent with their automatic scores differing from those of Qwen3.8 Max (0902) by less than 0.03 on every metric. Gemini 3.1 Pro Preview and Doubao-Seed-2.1-pro lose to the baseline on at least half of the webpages in both dimensions, again matching their low automatic scores. All eight metrics correlate positively with human preferences, with Spearman's ρ ranging from 0.667 to 0.737.
Compared with static appearance, every model obtains a lower win rate and a higher tie rate on animation. The rise in ties is particularly pronounced for weaker models: the tie rates of DeepSeek V4.1 Flash, GLM 5.3 Flash, Gemini 3.1 Pro Preview, and Doubao-Seed-2.1-pro rise from 12%–20% to 30%–40%.
When neither animation closely follows the reference, annotators find little basis to prefer one over the other, echoing our finding that reproducing animation remains challenging.